You tested positive, but are you really sick? When a positive isn’t so positive: Uncovering the Math doctors often Overlook…
Introduction
You tested positive. Your heart skips. The doctor’s tone shifts. But what does that result actually mean? Most people assume a positive test confirms the worst; that the disease is certainly present. In reality, the situation is far more subtle. Beneath the clinical certainty lies a quiet storm of probabilities, assumptions, and statistics. This post is about peeling back that veil using math, not emotion to ask a simple but critical question: What are the chances you’re actually sick? And the answer, surprisingly, often has little to do with the test result itself.
Assume a certain company manufactured a device, let’s call it T, to detect the presence of a disease D for example, a mammogram scanner to detect breast cancer.

But nothing in life is perfect, and this device might sometimes show a positive result for a woman who is actually healthy, or a negative result for a woman who does have the disease. You’d agree that the company certainly wants these two situations to happen as rarely as possible, right? On the contrary, it wants the device to show a positive result when the woman is truly sick, and a negative result when she is truly healthy, and to do so with high reliability.
Relevant statistical quantities are in?
Now let’s start flavoring the problem with a bit of mathematical spice. We’ll use \( (T = +) \) and \( (T = -) \) to represent a positive or negative test result, and we’ll let \( D \) stand for the presence of the disease and \( D^c \) for its absence. Let $N$ be the number of women withing our community. Based on the setup above, the following table illustrates the situation as well as the quantities we’re going to deal with.
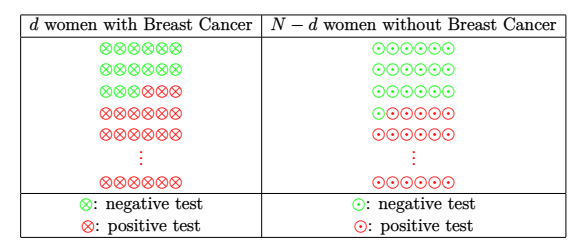
Fig. 1
$$\begin{alignedat}{1}\Pr(D) & =\frac{d}{N}\\
\Pr(T=+) & =\frac{\mathbin{\color{red}\otimes}+\mathbin{\color{red}\odot}}{N}\\
\Pr(T=+\mid D) & =\frac{\mathbin{\color{red}\otimes}}{d}\\
\Pr(T=-\mid D^{c}) & =\frac{\mathbin{\color{green}\odot}}{N-d}
\end{alignedat}$$
These cover all the possible combinations between the test result and the actual health status.
The quantity $\Pr(D) is called Prevalence. The quantity $\Pr(T=+\mid D)$ is called Sensitivity of the test (true positive rate). The $\Pr(T=-\mid D^c)$ quantity is called Specificity of the test (true negative rate). Typically, the company wants them to be as high as possible. There is no direct formula relating sensitivity and specificity. Sensitivity and Specificity are independent test characteristics. One can be high while the other is low, Imagine !!! For example, the test T can detect almost all sick women, i.e $\Pr(T=+ \mid D) \approx 1$ and tag healthy women as sick as well, i.e $\Pr(T=- \mid D^c) \approx 0$. In the same context, two relevant quantities pop up :
False positive rate = 1 – Specificity.
False negative rate = 1 – Sensitivity.
Of course, you agree that the company wants them small.
The sensitivity $\Pr(T=+ \mid D)$ is informative and known, it is simply collected when conducting the test T. However, the more relevant to a person who receives a positive diagnosis is the quantity $\Pr(D \mid T=+)$ of truly having the disease, which is what we want to know. I presume you are getting lost about what we know and what we don’t know, right? Don’t panic I had the same feeling.
The known quantities :
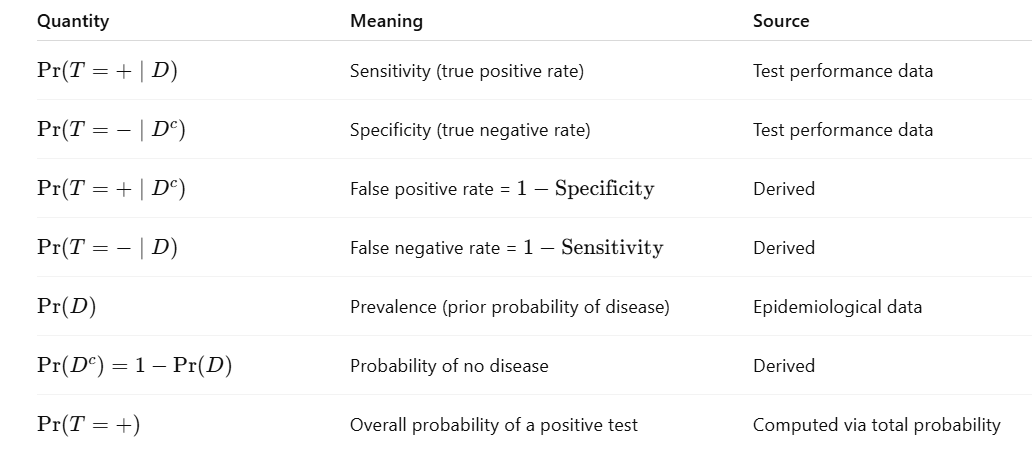
Fig. 2
The unknown quantities :
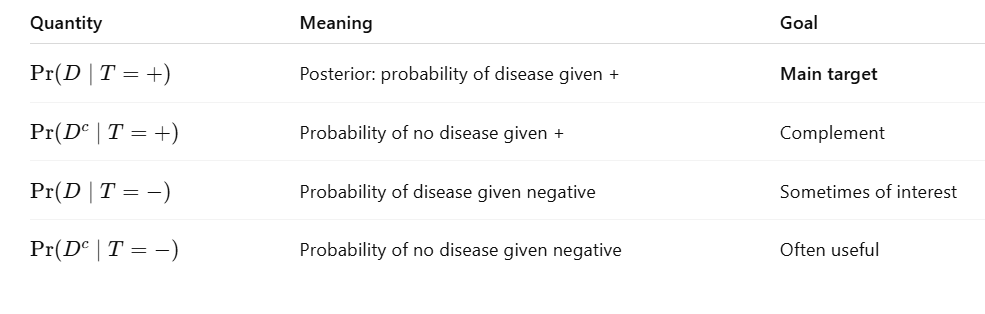
Fig. 3
I hope these tables can keep you on the track now. As you can see, our goal is to estimate $\Pr(D \mid T=+)$.
Bayes’ rule, you have the floor !!!
At this stage Bayes’ rule comes in. Let’s recall first its statement.
Theorem (Bayes’ rule). If $A,B$ are two events with positive probabilities, then $\Pr(A\mid B)$ and $\Pr(A\mid B)$ are related by $$\Pr(A\mid B)=\frac{\Pr(B)}{\Pr(A)}\Pr(B\mid A).$$
In our case, we obtain $$\Pr(D \mid T=+)=\frac{\Pr(T=+)}{\Pr(D)}\Pr(T=+\mid D).$$ As you may notice, the posterior probability $\Pr(D \mid T=+)$ is proportional to $\Pr(T=+\mid D)$ with the coefficient $\frac{\Pr(T=+)}{\Pr(D)}$. This explain our early remark that both quantities can fluctuate differently.
Let’s consider this example (taken from Foundations of Statistics for Data Scientists of Alan Agresti and Maria Kateri). Here, conditional probabilities of diagnosis given true disease status, for breast cancer mammograms.
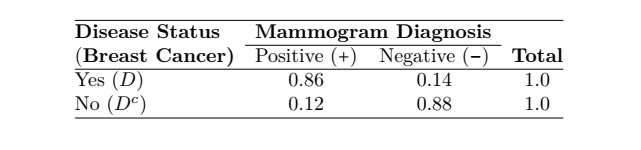
Fig. 4
Assume that the proportion of females having breast cancer is 0.01. This means that out of 1000 women, only one has the decease. Using the information provided by the table, we compute
$$\begin{alignedat}{1}\Pr(D\mid T=+) & =\frac{\Pr(D)}{\Pr(T=+)}\Pr(T=+\mid D)\\
& =\frac{\Pr(D)}{\Pr(T=+\mid D)\Pr(D)+\Pr(T=+\mid D^{c})\Pr(D^{c})}\Pr(T=+\mid D)\\
& =\frac{0.01}{0.86\times0.01+0.12\times0.99}0.86\\
& =0.0675
\end{alignedat}
$$
So, less than 7% really have the decease after getting a positive test !!! That is the point, sensitivity of the test can be high (0.86%) while the probability of decease give a positive test is low.
Conclusion
Many people, even health professionals, instinctively believe that if a test is very accurate (say, it detects the disease when it’s there, and doesn’t when it’s not), then a positive result must mean you’re very likely sick. That is, they assume quantities like
\[
P(T = + \mid D), \quad P(T = – \mid D^c), \quad \text{and} \quad P(D \mid T = +)
\]
are all tightly linked. But here’s the catch: they aren’t. A test can be highly sensitive and specific, yet still mislead you completely about whether you have the disease. Why? Because the probability that you’re actually sick given a positive result depends not only on the test, but also on how common the disease is in the first place; the prevalence. These quantities live in different worlds: one is about how the test performs in controlled conditions, the other is about what the result actually means in the real world.
4 responses to “You tested positive, but are you really sick? When a positive isn’t so positive: Uncovering the Math doctors often Overlook…”
Leave a Reply
You must be logged in to post a comment.
i am glad to discover you activities Prof.
glad to discover your website Prof
https://shorturl.fm/AtKL8
https://shorturl.fm/hUewd